Analyzing numerical data is critical across industries, yet many find MATLAB’s learning curve too steep.
Luckily, anyone can leverage MATLAB’s powerful numerical analysis capabilities by following several key steps for importing, cleaning, visualizing, and modeling data.
This guide will walk through essential techniques like reading files, handling missing data, exploring relationships, and even deploying predictive models. You’ll unlock MATLAB’s full potential for unlocking insights from numerical data.
Introduction to Analyzing Numerical Data with MATLAB
MATLAB is a programming platform optimized for numerical computing tasks like data analysis, visualization, and algorithm development. With its mathematical functions, statistical and machine learning toolboxes, and capabilities for cleaning, manipulating and analyzing data, MATLAB is well-suited for working with numerical data sets.
Understanding MATLAB’s Role in Numerical Analysis
MATLAB provides a flexible environment for analyzing all kinds of numerical data across scientific, engineering, and other technical domains. Its key capabilities useful for numerical data analysis include:
- Importing/exporting data from various file formats like CSV, Excel, databases, and web APIs
- Cleaning and preprocessing data for analysis
- Visualizing and exploring data with plots, charts and dashboards
- Applying statistical, machine learning, and deep learning models
- Performing numerical computing with matrix math and algorithms
- Custom programming and automation using MATLAB code
With these features, MATLAB provides everything needed for numerical data analysis in one integrated platform.
Essential Features of MATLAB for Data Analysis
Key capabilities of MATLAB that make it valuable for analyzing numerical data include:
- Import and Export – Easily bring data into MATLAB from files, databases or external sources and export analysis results.
- Data Wrangling – Clean, organize, access, and transform data for analysis with MATLAB’s data processing functions.
- Visualization – Interactive charts, plots and dashboards to explore data visually.
- Analytics and Modeling – Apply statistical, machine learning, and deep learning models out-of-the-box.
- Programming – Automate data tasks by writing custom MATLAB code and scripts.
- Toolboxes – Domain-specific toolboxes like statistics, machine learning and signal processing to enhance analysis.
With its specialized tooling for numerical computing, MATLAB provides a user-friendly workflow for working with numerical data sets.
How to do data analysis using MATLAB?
MATLAB provides a powerful platform for analyzing all kinds of data. Here are some key steps to get started with data analysis in MATLAB:
Import and organize your data
MATLAB makes it easy to import data from a variety of sources like Excel, CSV files, databases, and web APIs using commands like readtable() and webread(). You can store and access your data in MATLAB arrays, tables, timetables, maps and other data types. This keeps your data organized and makes subsequent analysis easier.
Clean and preprocess the data
Real-world data often contains errors, missing values and inconsistencies. MATLAB provides a range of functions in the Data Processing Toolbox for identifying anomalies, handling missing data, removing outliers etc. This data cleaning step improves the accuracy of downstream analysis.
Visually explore the data
Visualizations help uncover patterns, trends and relationships in data. MATLAB offers a rich set of plotting functions and customizable charts to visualize data. The interactive UI also lets you pan, zoom and rotate graphs to deeply understand data.
Apply statistical and machine learning analysis
With MATLAB you can analyze data using a vast library of mathematical, statistical, signal processing, optimization and machine learning algorithms. This lets you model data behavior, make predictions, classify data points, identify clusters and more.
In summary, MATLAB provides a complete platform to import, prepare, visualize, model and analyze all varieties of data with ease. The combination of a high-level language, interactive environment and access to domain-specific toolboxes makes MATLAB ideal for data analysis.
What is numerical analysis in MATLAB?
Numerical analysis refers to a branch of mathematics that focuses on developing algorithms and methods to obtain numerical solutions to problems rather than analytical solutions. MATLAB is a popular programming language and environment used across many fields for numerical analysis due to its specialized toolboxes geared towards this purpose.
Some key aspects of using MATLAB for numerical analysis include:
- Powerful built-in math and statistics functionality – MATLAB has extensive capabilities for matrix algebra, data analysis, signal processing, optimization, and more. This makes it well-suited for numerical computations.
- Specialized toolboxes for numerical methods – Toolboxes like Statistics and Machine Learning, Optimization, and Signal Processing contain functions tailored specifically for numerical analysis techniques. These provide robust and optimized implementations.
- Visualizations and simulations – MATLAB’s plotting and visualization tools allow you to graphically represent numerical analysis results. Its ability to integrate computation and visualization is valuable for interpreting numerical data.
- Programming language flexibility – MATLAB includes a full-featured programming language, so you can create custom scripts and functions to implement unique numerical algorithms if needed.
In fields like engineering, finance, and science, MATLAB is ubiquitous for numerically analyzing real-world problems that don’t have clean analytical solutions. Its balance of power, specificity, and flexibility drive its popularity for numerically-intensive work.
How to read numerical data from text file to MATLAB?
To read numerical data from a text file into MATLAB, follow these steps:
- Create a sample text file containing numerical data. For example:
1 2.5
2 3.7
3 1.2
- Use the
fopenfunction to open the file for reading. Specify the filename and file access mode.
fileID = fopen('data.txt','r');
- Use the
textscanfunction to read the contents of the file into a numeric array. Specify the file ID and format of the data.
A = textscan(fileID,'%f%f','Delimiter','\n');
- Close the file using
fclose(fileID). - Access the imported data from the output cell array
A. The numbers will be contained in the first cellA{1}.
fclose(fileID);
data = A{1};
The key steps are opening the file with fopen, parsing the numeric contents into a MATLAB array using textscan, and closing the file handle. This allows you to directly work with the imported dataset in MATLAB for any subsequent numerical analysis.
What is MATLAB and how does it facilitate numerical computations and data analysis?
MATLAB is a programming language and platform designed specifically for engineers and scientists to analyze data, develop algorithms, and create models. Here are some of the key ways MATLAB facilitates numerical computations and data analysis:
- Matrix-based language: MATLAB is built around matrix and vector computations which makes it easy to express computational mathematics. You can perform numerical computations without having to write complex code.
- Powerful built-in math functions: MATLAB comes packed with thousands of math functions for numerical analysis, statistics, Fourier analysis, filtering, optimization, numerical integration etc. This eliminates the need to code complex numerical methods from scratch.
- Interactive environment: The MATLAB desktop provides an interactive environment for iterative exploration, design and problem-solving. You can see results instantly which facilitates faster experimentation.
- Visualizations and graphics: MATLAB makes it very easy to visualize data with high-quality 2D and 3D plots. Visual analysis is key for gaining insights from data.
- Toolboxes for machine learning and data science: Toolboxes like Statistics and Machine Learning Toolbox help you prepare and analyze data, train predictive models, etc. This makes MATLAB a great platform for data science.
- Programming, apps and deployment: You can automate analysis by creating scripts and apps with MATLAB code. These can also be deployed to enterprise systems for integration with databases and IT infrastructure.
In summary, MATLAB provides a high-level environment specifically tailored for numerical computations, analysis and visualization – key capabilities needed for data analysis and engineering design tasks. Its rich built-in math functionality and flexible programming environment boost productivity.
sbb-itb-0c864d8
Preparing Numerical Data for Analysis in MATLAB
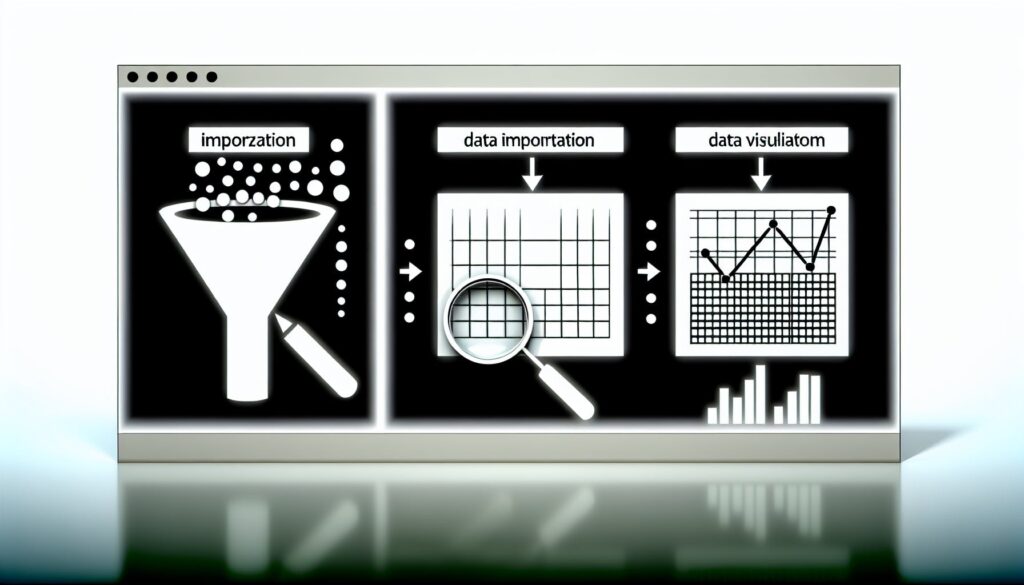
MATLAB provides a robust environment for importing, manipulating, analyzing, and visualizing numerical data. By following a core workflow, you can effectively prepare datasets for deeper analysis.
Importing and Organizing Numerical Data with MATLAB
MATLAB offers several functions to import numerical data from external sources:
readtable(): Import data from CSV files and Excel spreadsheets into a table data typedatastore(): Access data from databases and cloud sourceswebread(): Import data directly from web URLs
Best practices for organizing data include:
- Storing different data sets in separate table variables
- Adding descriptive variable names and table metadata
- Saving data files within MATLAB or the Current Folder for easy access
Cleaning and Preprocessing Numerical Data in MATLAB
Before analysis, it’s critical to clean and preprocess data:
fillmissing(): Replace missing values with estimatesrmmissing(): Remove rows and columns with missing valuesnormalize(): Rescale data to a standard rangesmoothdata(): Remove noise from data
Cleaning data fixes structural issues, while preprocessing transforms raw data into a refined set ready for modeling and statistics.
Visualizing Data: MATLAB Graphics for Numerical Insights
MATLAB makes it easy to visualize numerical data with functions like:
scatter(): Plot correlations between variablesheatmap(): Highlight patterns in large datasetsboxplot(): Identify statistical distribution and anomalies
The key is choosing the right visuals to uncover specific insights from the data. Interactive graphics allow further exploration once the initial plots are created.
By importing data correctly, preprocessing it, and creating meaningful visualizations, you can reveal key insights for further numerical analysis using MATLAB’s full modeling and statistics toolbox.
Advanced Numerical Data Analysis Techniques with MATLAB
MATLAB provides a robust set of capabilities for going beyond basic numerical data analysis to apply more advanced quantitative techniques. From machine learning to signal processing, MATLAB empowers data analysts to unlock deeper insights.
Applying Statistics and Machine Learning Toolbox to Numerical Data
The Statistics and Machine Learning Toolbox within MATLAB enables analysts to leverage cutting-edge techniques on numerical data sets. Some key methods include:
- Regression analysis – Fit predictive models like linear regression, logistic regression, and nonlinear regression to numerical input data. Assess model quality and statistical significance.
- Classification – Train classifiers like SVM, KNN, decision trees, etc. on numerical features. Evaluate performance via confusion matrices, ROC curves.
- Clustering – Group unlabeled numerical data into clusters using algorithms like K-means, hierarchical clustering. Analyze clustering quality.
- Anomaly detection – Identify anomalies and outliers in numerical data using isolation forests, one-class SVM and other techniques.
- Forecasting – Forecast future numerical time series values via exponential smoothing, ARIMA, deep learning models. Assess accuracy.
- Deep learning – Build and train deep neural networks on numerical input data for prediction, classification, clustering.
These methods enable deeper analysis of patterns, trends and relationships within numerical data sets.
Signal Processing and Time Series Analysis with MATLAB
MATLAB provides an extensive signal processing toolbox for analyzing numerical time series data. Key capabilities include:
- Spectral analysis – Apply Fourier transforms for frequency domain analysis, power spectral density estimation of signals.
- Digital filtering – Design and apply filters like low-pass, high-pass, band-pass, notch filters for signal conditioning.
- Time series models – Fit AR, MA, ARMA, ARIMA models on numerical time series data for forecasting and prediction.
- Wavelet analysis – Employ wavelet transforms for time-frequency analysis of nonstationary signals.
These techniques enable analyzing and modeling temporal characteristics of numerical data.
Numerical Methods Using MATLAB: Optimization and Differential Equations
MATLAB enables solving quantitative problems involving:
- Numerical optimization – Find optimal parameters for functions using techniques like linear programming, quadratic programming, nonlinear least-squares, gradient descent.
- Ordinary differential equations (ODEs) – Numerically solve first-order ODEs using methods like Euler’s, Runge-Kutta.
- Partial differential equations (PDEs) – Solve PDEs numerically via finite element analysis, finite difference methods.
These numerical methods expand MATLAB’s quantitative analysis capabilities for addressing complex modeling and optimization problems on numerical data.
By leveraging advanced techniques like machine learning, signal processing, and numerical computing methods, data analysts can gain deeper insights from numerical data sets using MATLAB. Its breadth of quantitative capabilities empowers revealing rich information.
Enhancing Numerical Data Analysis with MATLAB’s Advanced Tools
MATLAB offers advanced capabilities to scale numerical data analysis to large datasets, integrate with external tools, and deploy analytics into production systems.
Scaling Data Analysis with MATLAB Tall Arrays and Parallel Computing Toolbox
MATLAB supports tall array data structures to work with out-of-memory datasets too large to fit in RAM. By keeping the data on disk and loading subsets into memory when needed, analyses can be performed on datasets larger than available RAM.
The Parallel Computing Toolbox provides distributed arrays to split data across multiple machines, enabling faster computations by processing data in parallel. GPU computing functionality accelerates numerical algorithms by offloading operations to the graphics card.
These capabilities allow users to efficiently analyze big data in MATLAB without downsampling or moving to lower-level languages like C++.
Deploying MATLAB Analysis to Enterprise and Embedded Systems
MATLAB analytics can be deployed to external production systems in various ways:
- Compile into web apps, databases, C/C++, Java, and .NET applications using MATLAB Compiler SDK
- Call MATLAB code through generated APIs using MATLAB Production Server
- Embed MATLAB code on small devices with MATLAB Coder
This makes it easy to integrate advanced numerical analysis from MATLAB experiments into enterprise pipelines, web platforms, mobile apps, and embedded electronics without rewriting algorithms.
Speeding Up Data Preprocessing for Machine Learning with MATLAB
MATLAB provides various methods to accelerate the data preprocessing steps common in machine learning workflows:
- Automate repetitive data cleaning tasks with the Data Cleaner app
- Use parallel for-loops and GPU arrays to process data faster
- Leverage tall arrays to work with large datasets that don’t fit in memory
- Filter, transform, normalize, etc. data in fewer lines of code with data preprocessing functions
Optimizing data preprocessing in this way significantly reduces the time spent preparing data for training and testing machine learning models in MATLAB.
Practical Applications and Case Studies of MATLAB in Numerical Analysis
MATLAB is widely used across various industries and research settings for numerical analysis due to its specialized toolboxes geared towards math, statistics, and data analysis. Here are some real-world examples and case studies highlighting practical applications of MATLAB’s capabilities.
Analyzing Fleet Test Data with MATLAB for Fuel Economy Analysis
The automotive industry relies heavily on test data analysis to evaluate vehicle performance and fuel efficiency. MATLAB provides built-in tools to import, preprocess, visualize, and analyze large datasets from fleet tests and dynamometer measurements.
Researchers used MATLAB’s Parallel Computing Toolbox to accelerate analysis of a complex dataset with over 300 GB of fleet test data from 1 million miles of driving [1]. By utilizing parallel for-loops and tall arrays with GPU support, they reduced processing time from days to just 3 hours. This enabled rapid iteration for identifying optimum powertrain calibrations for maximizing fuel economy.
MATLAB’s Live Editor also allows quick visualization and sharing of results with interactive reports. Engineers can seamlessly collaborate to gain insights from fleet test data for improving fuel efficiency.
Numerical Analysis in Research: MATLAB for Scientific Data
MATLAB is ubiquitous in academic research across science, engineering, and economics for numerical analysis. Its mathematical modeling and simulation capabilities are vital for working with large scientific datasets.
A recent study demonstrated MATLAB’s use in meteorology to model extreme rainfall events with numerical weather predictions [2]. Researchers leveraged the Parallel Computing Toolbox for faster simulation of high-resolution forecast models. This reduced prediction uncertainty during dangerous storm systems.
Another paper illustrated applying numerical methods in MATLAB to identify disease biomarkers from proteomic mass spectrometry data [3]. The MATLAB bioinformatics and statistics toolboxes enabled rapid analysis of complex protein datasets. This showcases MATLAB’s versatility in biological research.
These examples highlight MATLAB’s extensive applications for numerical analysis across domains. From automotive to medicine, MATLAB provides the mathematical toolbox for working with diverse numerical data.
[1] MathWorks, “Analyzing Fleet Test Data”, 2022.
[2] P. Lopez et al., “Very high resolution rainfall fields produced by numerical weather prediction models”, Water Resour. Res., Vol. 53, 2017.
[3] X. Li et al, “Numerical detection and quantification of differential protein expression in label-free LC-MS data”, Bioinformatics, Vol. 33(2), 2016.
Conclusion and Key Takeaways
MATLAB provides a powerful platform for analyzing numerical data across a wide range of applications. Some key takeaways:
- MATLAB makes it easy to import, preprocess, visualize, and model numerical data with built-in functions and customizable workflows. The Live Editor enables rapid iteration.
- Capabilities like parallel computing, tall arrays, and GPU support facilitate fast analysis of big data. Models can be deployed at scale with MATLAB Compiler and MATLAB Production Server.
- Domain-specific toolboxes allow tailored analysis for applications like predictive maintenance, finance, image processing, and more. The Statistics and Machine Learning Toolbox enables statistical analysis and machine learning techniques.
- Interactive apps like Data Cleaner lower barriers for non-experts to prepare quality datasets. MATLAB graphics and visualization tools deliver meaningful insights from complex numerical data analysis.
- With robust data processing capabilities and flexibility to connect with external databases and languages like Python, MATLAB provides a full-featured platform for numerical data science.
For those looking to enhance their data analysis skills, MATLAB provides accessible tools to wrangle, model, and visualize numerical data at scale. The wide range of domain-specific toolboxes also enables customized analysis across industries. With powerful computational capabilities optimized for working with numbers, MATLAB is an excellent choice for numerical data analysis.
Related posts
- Skills to Learn for Data Analyst: A Comprehensive Guide
- Data Analyst’s Roadmap: Navigating Your Career Path
- Data Analyst Skills: From Basics to AI Integration
- Data Analyst Roadmap: Essential Skills and Tools

Tech Writer | Data Analyst | Digital Creator


