Most Useful Excel Functions for Data Analysis: A Concise Guide
Microsoft Excel is a powerful tool that offers numerous functionalities for users, particularly those involved in data analysis. Excel comes with a wide array of functions, which can aid in performing tasks ranging from simple calculations to more complex analysis. Mastering these functions can significantly improve efficiency and accuracy, allowing data analysts to extract valuable insights from raw data.
Among the many Excel functions available, some of the most useful for data analysis include VLOOKUP, COUNTIFS, SUMIF, and IF + AND/OR. For instance, VLOOKUP enables users to retrieve data from a vertically organized table with ease, while COUNTIFS allows for the counting of values that meet specific criteria. Familiarity with these functions is vital for data analysts to fully utilize Excel’s capabilities and streamline their workflows.
Becoming proficient in Excel functions for data analysis requires practice and dedication. As users continue to learn and apply these techniques, their data analysis skills will become increasingly proficient, enabling them to effectively turn raw data into valuable insights for decision-making.
Getting Started with Excel for Data Analysis
Importance of Excel in Data Analysis
Excel plays a crucial role in data analysis due to its versatility, accessibility, and wide range of functions. Many professionals, from beginner to advanced data analysts, utilize Excel to manage, organize, and analyze their data. Its user-friendly interface and extensive toolset make it suitable for various data-related tasks, such as data cleaning, visualization, and calculation.
One of the key benefits of using Excel for data analysis is the numerous built-in functions that save time and effort. Excel functions are designed to perform specific operations, aiding in the automation and efficiency of data analysis tasks. For data analysts, knowing and mastering these functions is essential to improving their workflow and achieving better results.
Related Article: 37 Libraries of Python to Master Data Science.
Understanding Excel Functions
Excel offers a rich collection of functions for data analysis, including lookup functions, statistical functions, text manipulation, and logical functions. Some of these essential functions are:
- VLOOKUP: Used to retrieve or look up data in a table organized vertically. VLOOKUP searches for a specific value in the first column of an array or dataset and returns a single value from the same row where the lookup value was found. VLOOKUP function is crucial for data analysts, as it helps in automatically finding data in another spreadsheet, provided each row has an ID.
- COUNTIFS: Counts the number of values that meet specified criteria within a range. Unlike the SUMIFS function, the COUNTIFS function does not require a sum range.
- AVERAGEIFS, MAXIFS, MINIFS: These functions are used to calculate the average, maximum, and minimum values with specified criteria, similar to the COUNTIFS function.
- IF, AND, OR: Logical functions are crucial for testing specific conditions and returning a result based on those conditions. These functions can be combined to create complex formulas, enhancing the capabilities of Excel for data analysis.
- TEXT Functions: Excel provides various functions for manipulating and managing text data, such as LEFT, RIGHT, MID, and LEN. These functions are beneficial for cleaning and organizing text-based data during the analysis process.
By understanding and mastering the most useful Excel functions for data analysis, analysts can perform tasks more efficiently and effectively, saving time and producing better insights. Excel remains an invaluable tool for data analysts, offering a powerful and easy-to-use platform for data manipulation, exploration, and visualization.
Related Article: A Beginners Guide to Using R for Data Analysis
Most Commonly Used Excel Functions in Data Analysis
Next, we will walk you through 15 commonly used Excel functions, explaining their purpose, syntax, and how they can be applied to real-world data analysis scenarios. From concatenating text values to performing conditional calculations and finding specific data points, these functions will become valuable assets in your data analysis toolkit.
By mastering these Excel functions, you’ll be able to efficiently clean and organize your data, perform complex calculations, and uncover patterns and trends. Whether you’re a beginner looking to enhance your Excel skills or an experienced data analyst seeking to expand your knowledge, this section will provide you with the foundation to excel in data analysis using Excel.
So, let’s dive into the world of Excel functions and discover how they can empower you to unlock the insights hidden within your data.
1. Concatenate Function
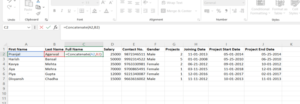
The CONCATENATE function in Excel combines text strings into a single cell. It’s used to merge text values from different cells or input text.
In data analysis, CONCATENATE is handy for merging first and last names, creating unique identifiers, and generating personalized messages. It simplifies data preparation and enhances efficiency by customizing and formatting text values.
By understanding and applying CONCATENATE, data analysts streamline tasks and organize text, facilitating smoother data analysis workflows.
SYNTAX = CONCATENATE (text1, text2, [text3], …)
2. Len() Function
The LEN() function in Excel is used to determine the length of a given text string. Its purpose is to count the number of characters in a cell, including letters, numbers, spaces, and special characters. This function is particularly useful in data analysis when you need to assess the length of text entries or check for any data discrepancies.
In real-world data analysis scenarios, the LEN() function can be applied to various tasks. For example, you can use it to identify and highlight cells with text exceeding a certain character limit, filter or sort data based on text length, or calculate the average or maximum length of a range of text entries. By understanding the length of text strings, you can gain insights into data quality, perform data cleansing tasks, or make informed decisions based on specific text characteristics.
SYNTAX = LEN (text)

3. Days() Function
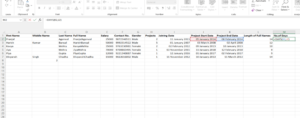
The DAYS() function in Excel is designed to calculate the number of days between two given dates. Its purpose is to provide a simple and straightforward way to determine the duration or the gap in days between two specific dates.
The DAYS() function can be applied to various situations. For example, you can use it to calculate the duration of a project by subtracting the start date from the end date, or to determine the number of days between customer orders to analyze purchasing patterns. Additionally, the function can help identify the age of individuals by calculating the number of days between their birthdate and the current date.
By leveraging the DAYS() function, data analysts can perform time-based calculations, track durations, and gain insights into temporal relationships within their datasets. It simplifies the process of calculating time intervals and enables analysts to make informed decisions based on time-related metrics.
SYNTAX =DAYS (end_date, start_date)
4. Networkdays Function
The NETWORKDAYS() function in Excel is specifically designed to calculate the number of working days between two given dates, excluding weekends and optionally specified holidays. Its purpose is to provide an efficient way to determine the duration or the gap in working days between two specific dates.
The NETWORKDAYS() function is widely used. For example, it can be applied to calculate project timelines by excluding weekends and holidays, allowing analysts to accurately estimate project completion dates. It can also be used to measure service-level agreements by calculating the number of working days between request dates and resolution dates.
By utilizing the NETWORKDAYS() function, data analysts can easily calculate working days, evaluate turnaround times, and assess efficiency within their datasets. It simplifies the process of handling business-related time intervals and enables analysts to make data-driven decisions based on working-day metrics.
SYNTAX = NETWORKDAYS (start_date, end_date, [holidays])
5. Sumifs() Function
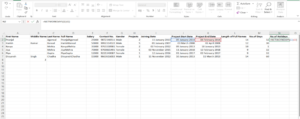
The SUMIFS() function in Excel is a powerful tool for summing values based on multiple criteria. Its purpose is to calculate the sum of values that meet specific conditions or criteria within a range of data.
For example, it can be applied to analyze sales data by summing the sales of specific products within a certain time period or to calculate the total revenue generated by a particular region or customer segment.
By utilizing the SUMIFS() function, data analysts can easily perform complex calculations and extract meaningful insights from their datasets. It allows them to filter and aggregate data based on multiple conditions, enabling targeted analysis and precise calculations.
The SUMIFS() function is a valuable tool for data analysts as it provides flexibility in performing conditional sums. It streamlines data analysis tasks by eliminating the need for manual sorting and filtering, saving time and effort. With its ability to handle multiple criteria, analysts can gain deeper insights into their data and make informed business decisions based on specific conditions.
SYNTAX = SUMIFS (sum_range, range1, criteria1, [range2], [criteria2], …)
6. Averageifs() Function
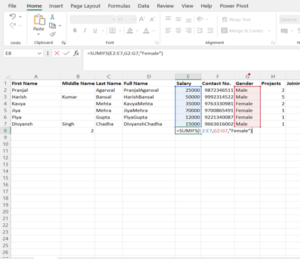
The AVERAGEIFS() function in Excel is a useful tool for calculating the average of values that meet multiple criteria. Its purpose is to calculate the average of a range of values based on specified conditions or criteria.
For example, it can be applied to calculate the average sales of a particular product within a specific time frame or to determine the average rating given by customers based on specific characteristics or attributes.
By utilizing the AVERAGEIFS() function, data analysts can easily calculate averages based on specific conditions or criteria, providing insights into the central tendency of the data under certain circumstances. It allows analysts to filter and analyze data based on multiple criteria, enabling targeted analysis and precise calculations.
The AVERAGEIFS() function simplifies the process of calculating conditional averages in Excel. It eliminates the need for manual sorting and filtering of data, saving time and effort. By considering multiple criteria, analysts can obtain more accurate and meaningful average values, leading to informed decision-making.
SYNTAX = AVERAGEIFS (avg_rng, range1, criteria1, [range2], [criteria2], …)
7. Countsifs() Function
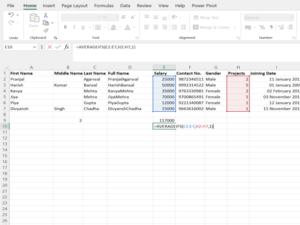
The COUNTIFS() function in Excel is a powerful tool for counting the number of cells that meet multiple criteria. Its purpose is to count the occurrences of a specific condition or combination of conditions within a range of data.
It allows data analysts to count the occurrences of specific events or attributes based on multiple criteria. For example, it can be applied to count the number of sales transactions that meet certain conditions, such as sales made by a particular salesperson within a specific time period.
By utilizing the COUNTIFS() function, analysts can quickly obtain the count of data points that match specific criteria, providing valuable insights into the frequency of occurrence and distribution of data based on various conditions.
The COUNTIFS() function simplifies the process of counting data points that meet multiple criteria in Excel. It eliminates the need for manual sorting and filtering, saving time and effort. By considering multiple conditions, analysts can obtain accurate counts of data points that satisfy specific criteria, enabling them to gain a deeper understanding of the data and draw meaningful conclusions.
SYNTAX = COUNTIFS (range, criteria)
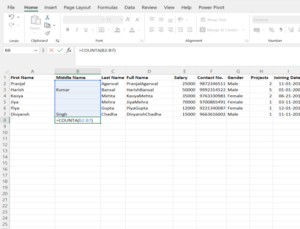
8. Counta() Function
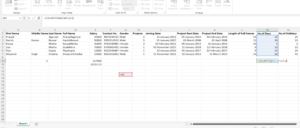
The COUNTA() function in Excel serves the purpose of counting the number of non-empty cells within a given range. It counts cells that contain any type of data, including text, numbers, and logical values.
The COUNTA() function is commonly used to determine the completeness or occupancy of a dataset. It helps analysts assess the amount of available data and identify any missing or empty values.
By applying the COUNTA() function, analysts can quickly calculate the total count of non-empty cells in a range, which provides insights into the data’s comprehensiveness and the presence of any gaps or missing values. This information is crucial for data quality assessment and decision-making processes.
The COUNTA() function is particularly useful when working with large datasets or data entry forms, where it can help identify missing information, detect outliers, or assess the level of data completeness. It simplifies the process of data validation and ensures that all required fields are populated.
In addition, the COUNTA() function can be combined with other functions or used in conjunction with data filtering techniques to obtain specific counts based on certain conditions. This enables analysts to perform targeted data analysis and gain a deeper understanding of the dataset’s characteristics.
SYNTAX = COUNTA (value1, [value2], …)
9. Vlookup() Function
VLOOKUP stands for ‘Vertical Lookup.’
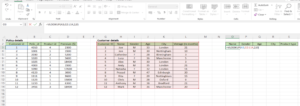
The VLOOKUP() function in Excel is designed to search for a specific value in the leftmost column of a table or range and retrieve a corresponding value from a specified column. Its purpose is to perform a vertical lookup, hence the name “VLOOKUP.”
The VLOOKUP() function is widely used for data matching and merging. It allows analysts to find and extract relevant information from large datasets by searching for a key value and retrieving associated data from another column.
One common application of the VLOOKUP() function is in performing data reconciliation. For example, when consolidating data from multiple sources or tables, analysts can use VLOOKUP() to find matching values in one dataset and retrieve corresponding data from another dataset. This helps in combining data from different sources and creating a unified view.
Another use case is data validation. Analysts can employ the VLOOKUP() function to check if a value exists in a reference table or list. This is helpful for ensuring data accuracy and detecting any discrepancies or errors in the data.
The VLOOKUP() function can also be used for creating dynamic reports or dashboards. By linking the function to dropdown menus or input cells, analysts can enable users to select specific values and instantly retrieve relevant data.
SYNTAX = VLOOKUP (lookup_value, table_array, column_index_num, [range_lookup])
10. Hlookup() Function
HLOOKUP stands for ‘Horizontal Lookup’
The HLOOKUP function is similar to the VLOOKUP function, but instead of searching for a value in the first column of a table, it searches for a value in the first row and returns a corresponding value from a specified row. Its purpose is to horizontally lookup values in a table and retrieve information based on given criteria.
The HLOOKUP function can be applied to:
- Extract data from a table based on specific criteria, such as finding the sales figures for a particular month in a monthly sales report.
- Look up and retrieve information from a horizontal database, such as finding the details of a specific product from a product catalog.
- Populate a spreadsheet or report with data from another source by searching for matching values in a row.
- Analyze and compare data across different time periods or categories, such as comparing sales figures for different quarters or regions.
The HLOOKUP function is particularly useful when working with datasets that are organized horizontally, and you need to extract specific information based on criteria defined in the first row. It provides a flexible way to retrieve data from tables and supports various data analysis tasks, making it a valuable function for data analysts.
SYNTAX = HLOOKUP (lookup_value, table_array, row_index, [range_lookup])

11. If() Function
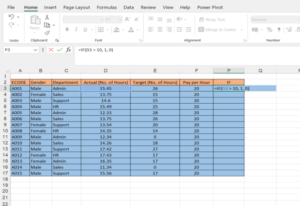
The IF() function is a powerful logical function in Excel that allows you to perform conditional evaluations. Its purpose is to test a specified condition and return different values based on whether the condition is true or false. This function helps in making decisions and performing calculations based on certain criteria.
IF() function can be applied to:
- Perform data categorization or segmentation based on specific conditions. For example, you can use the IF() function to categorize customers as “high-value” or “low-value” based on their purchase history.
- Calculate metrics or indicators based on predefined thresholds. For instance, you can use the IF() function to determine if a project is on track or behind schedule based on the completion percentage.
- Filter and manipulate data based on multiple conditions. By combining the IF() function with other functions like AND() or OR(), you can create complex logical expressions to filter and extract data that meets specific criteria.
- Handle errors or exceptions in data analysis. The IF() function can be used to check for potential errors or missing values in data and substitute them with appropriate values or error messages.
SYNTAX = IF (logical_test, [value_if_true], [value_if_false])
12. Iferror() Function
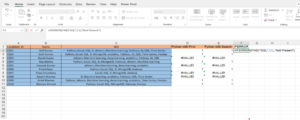
The IFERROR() function is a useful function in Excel that helps handle errors in formulas. Its purpose is to evaluate a formula and return a specified value if the formula generates an error. This function allows you to handle errors more gracefully and provide alternative values or actions when errors occur.
IFERROR() function can be applied to:
- Handle division errors: When performing calculations that involve division, errors like #DIV/0! can occur if the divisor is zero. By using the IFERROR() function, you can replace these errors with a specific value or message, such as “N/A” or “Not applicable.”
- Manage missing data: When working with large datasets, it’s common to encounter missing or incomplete data. The IFERROR() function can be used to identify missing values and substitute them with alternative values or zero, depending on the analysis requirements.
- Manage errors in complex formulas: Complex formulas involving multiple functions and operations can sometimes generate errors. The IFERROR() function can help identify and handle these errors by providing a fallback value or error message.
- Improve data accuracy: By using the IFERROR() function, you can ensure that your calculations and analyses are not affected by formula errors. Instead of displaying errors, you can display meaningful values or indicators to maintain data accuracy and reliability.
SYNTAX = IFERROR (value, value_if_error)
13. Find/Search Function
The FIND/SEARCH function in Excel is used to locate the position of a specific character or substring within a text string. Its purpose is to search for a specific value and return the starting position of that value within a given text. The FIND function is case-sensitive, while the SEARCH function is not case-sensitive.
FIND/SEARCH function can be applied to:
- Data cleansing and data extraction: When working with unstructured data or text strings, the FIND/SEARCH function can help identify specific patterns or characters within the text. This can be useful for extracting relevant information, such as finding specific keywords or substrings within a larger text.
- Data validation and quality checks: The FIND/SEARCH function can be used to perform data validation by checking if certain values or patterns exist in a dataset. For example, you can search for specific characters or symbols to ensure data consistency and quality.
- Text manipulation and formatting: By using the FIND/SEARCH function along with other text functions, you can manipulate and format text strings based on specific criteria. This can include replacing or removing certain characters, extracting parts of a text, or rearranging text based on the search results.
- Conditional logic and decision-making: The FIND/SEARCH function can be combined with other functions like IF or IFERROR to create conditional formulas. This allows you to perform actions or calculations based on the presence or absence of a specific value within a text string.
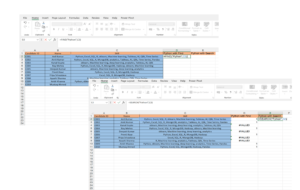
FIND returns the position of one text string within another
SEARCH will return results for Bigger or bigger, broadening the scope of the query.
SYNTAX = FIND (find_text, within_text, [start_num])
SYNTAX = SEARCH (find_text, within_text, [start_num])
14. Left/Right Function
The LEFT and RIGHT functions in Excel are used to extract a specified number of characters from the left or right side of a text string, respectively. The purpose of these functions is to manipulate text data by extracting a subset of characters from a larger string based on a given position or length.
To Analyse Data, LEFT, and RIGHT functions can be applied to:
- Data cleansing and formatting: When working with datasets containing text strings, the LEFT and RIGHT functions can help extract specific portions of text, such as extracting the first or last name from a full name field or extracting the date from a timestamp. This allows for better data organization and formatting.
- Data categorization and grouping: By extracting a specific number of characters from the left or right side of a text string, analysts can create new categories or groupings based on common patterns. For example, extracting the first few characters of a product code can help categorize products into different groups or classes.
- Conditional formatting and analysis: The LEFT and RIGHT functions can be used in combination with other functions and logical operators to create conditional formulas. This enables analysts to perform conditional formatting or analysis based on specific criteria, such as highlighting cells if they contain a certain pattern or counting the occurrence of specific characters.
- Data transformation and integration: The LEFT and RIGHT functions can be used to transform and integrate data from different sources. For example, extracting specific characters from a product code can facilitate data integration with other systems or databases.
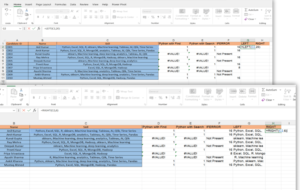
=RIGHT returns the “x” number of characters from the cell’s end
=LEFT returns the “x” number of characters from the cell’s beginning
SYNTAX = LEFT (text, [num_chars])
SYNTAX = RIGHT (text, [num_chars])
15. Rank() Function
The RANK() function in Excel is used to determine the rank of a value within a set of values. It assigns a rank to each value based on its position in the sorted list. The purpose of the RANK() function is to provide insights into the relative position or importance of values in a dataset.
To Analyse data, RANK() function can be applied to:
- Performance evaluation: The RANK() function can be used to rank individuals or entities based on their performance metrics, such as sales figures, customer satisfaction scores, or productivity measures. This allows for the identification of top performers, comparison of performance across different groups, and recognition of underperforming entities.
- Market analysis: By ranking products, brands, or competitors based on market share, sales volume, or customer preference, the RANK() function helps in assessing market competitiveness and identifying market leaders. It enables analysts to understand market dynamics, track changes over time, and make informed business decisions.
- Financial analysis: The RANK() function is often used in financial analysis to rank financial securities, such as stocks or bonds, based on their returns or performance. This helps investors identify investment opportunities, construct portfolios, and make investment decisions based on risk and return profiles.
- Data segmentation: The RANK() function can be applied to segment data into different groups or categories based on ranking criteria. For example, analysts can use the RANK() function to divide customers into tiers based on their purchasing behavior, assign priority to tasks based on their importance, or classify products based on their market performance.
- Data visualization: By assigning a rank to values, the RANK() function can facilitate the creation of visual representations, such as bar charts or scatter plots, to illustrate the distribution or hierarchy of data. This enhances data visualization and aids in conveying information effectively.
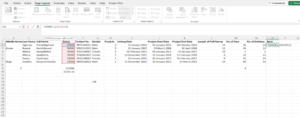
=RANK is a quick way to show how values in a dataset rank in ascending or descending order.
SYNTAX = RANK (number, ref, [order])
Related Article: The Importance of Data Analyst Portfolio for Job Seekers.
Handling Errors and Missing Data in Excel
Common Excel Errors
There are several common errors that can occur in Excel while performing data analysis. Some of the most frequent errors include:
- #REF!: This error occurs when a cell reference is not valid, such as when a formula refers to a deleted cell or a range that no longer exists.
- #NAME?: This error appears when Excel doesn’t recognize text in a formula, often due to a misspelled function name or an invalid range.
- #DIV/0!: This error occurs when you try to divide a number by zero or an empty cell.
- #VALUE!: This error appears when you use an incorrect data type or argument in a function, such as using text instead of a number.
Dealing with Missing Data
Handling missing data in Excel can make your analysis more accurate and efficient. Some techniques to manage missing data include:
- Using the
COUNTBLANKfunction to count the number of empty cells in a range. - Filtering out missing values before performing calculations.
- Replacing missing values with a specific number or a calculated value based on other available data.
- Utilizing functions like
AVERAGE,SUM, orMAXthat automatically ignore empty cells.
Error Handling Functions
Excel provides several functions to help you handle errors and missing data effectively during data analysis. These functions include:
- ISNA(): This function checks if a cell contains the #N/A error, which often occurs when a lookup function cannot find a specified value. The formula is:
=ISNA(value). - IFERROR(): This function allows you to specify a default value to be returned if the primary calculation encounters an error. The formula is:
=IFERROR(value, value_if_error). For example,=IFERROR(A1/B1, "N/A")returns “N/A” if the division results in an error.
By incorporating these error handling functions and techniques for dealing with missing data, you can create more accurate and reliable data analysis in Excel.
Advanced Excel Functions for Data Analysis
Excel Formula Combinations
Combining Excel functions can provide advanced capabilities in data analysis. One such combination involves the SUMPRODUCT function. SUMPRODUCT allows users to multiply corresponding components in given arrays and return the sum of those products, which is useful in various weighted average calculations. For instance, you can use SUMPRODUCT to find a total price by multiplying the number of items by their individual prices and sum these together.
Another useful combination is CONCATENATE and TRIM. CONCATENATE lets users join multiple text strings into one, while TRIM helps remove extra spaces within and around the text. Combining both functions offers a cleaner way to combine text from separate cells.
Dynamic Array Functions
Dynamic array functions are a set of powerful functions introduced in Microsoft Excel that allows users to work with arrays and spill results automatically into neighboring cells. Some of these functions include:
- AVERAGEIFS: Calculates the average of all cells that meet multiple criteria.
- MAXIFS: Computes the maximum value among cells that fulfill multiple conditions.
- MINIFS: Identifies the minimum value based on cells meeting specified criteria.
These functions will enable data analysts to deal with large amounts of data without extensive manual work using a single formula.
For instance, you can use the following table with product information:
| Product ID | Category | Price |
|---|---|---|
| 1 | A | 10 |
| 2 | B | 20 |
| 3 | A | 30 |
To find the average price of products in category A, you could use the AVERAGEIFS function as follows:
=AVERAGEIFS(C2:C4, B2:B4, "A")
This would return the average price of 20 ((10+30)/2).
Utilizing these types of functions help analysts extract relevant information from the data, perform lookups based on values, and work with numerical values in efficient and streamlined ways.
By mastering these Excel functions and techniques, data analysts can unlock the full potential of Excel as a powerful data analysis tool. They can elevate their analytical skills, streamline their workflows, and deliver valuable insights that drive informed decision-making.
So, embrace the power of Excel functions, explore their applications in real-world data analysis, and unlock a world of possibilities in your data-driven journey. Excel is not just a spreadsheet—it’s your gateway to uncovering the hidden stories within your data.
Excel Functions for Data Analysis: FAQs
1. What Excel functions do you find most useful?
Some of the most useful Excel functions for data analysis include SUM, AVERAGE, COUNT, IF, VLOOKUP, and CONCATENATE.
2. What Excel skills does a data analyst need?
Data analysts need Excel skills such as data manipulation, formula writing, data visualization, pivot tables, and data filtering.
3. What are the 5 main functions used in Excel?
The five main functions used in Excel are SUM, AVERAGE, COUNT, MAX, and MIN.
4. Are there any limitations or drawbacks of using Excel for data analysis, especially with larger datasets?
Yes, Excel has limitations with larger datasets such as slower performance, limited memory capacity, and potential data loss or errors.
5. What is VLOOKUP in Excel?
VLOOKUP is a function that allows you to search for a specific value in a column and retrieve a corresponding value from another column.
6. What is the fastest way to analyze data in Excel?
Using built-in Excel functions and features such as pivot tables, filters, and conditional formatting can help analyze data quickly and efficiently.
7. Are there any Excel add-ins or plugins that can enhance the data analysis capabilities of Excel?
Yes, there are several add-ins available for Excel that can enhance data analysis capabilities, such as Power Query, Power Pivot, and Data Analysis ToolPak.
8. Can Excel functions be used for predictive modeling or machine learning tasks?
While Excel functions have limited capabilities for predictive modeling and machine learning, they can be used for basic calculations and data preparation.
9. How do I analyze large data sets in Excel?
To analyze large data sets in Excel, it’s recommended to use techniques such as data filtering, pivot tables, and Power Query to handle and summarize the data efficiently.
10. Is Excel enough for data analysis?
Excel is a powerful tool for data analysis, especially for smaller datasets or basic analysis tasks. However, for more complex analysis and advanced statistical modeling, specialized software like Python or R may be more suitable.
What you should know:
- Our Mission is to Help you to Become a Professional Data Analyst.
- This Website is a Home for Data Analysts. Get our latest in-depth Data Analysis and Artificial Intelligence Lessons and Updates in your Inbox.

Tech Writer | Data Analyst | Digital Creator

